Manuscript
A manuscript scaffold connecting PING circuit dynamics, low-rate task performance, cycle participation, perturbation sensitivity and continuous-stream classification.
Abstract
We compared reciprocal excitatory–inhibitory circuits with loop-off controls, then tested trained MNIST classifiers under activity constraints, changes to inhibitory timing and spike perturbations. Reciprocal feedback supported rhythmic low-rate activity, while trained classifiers retained useful accuracy at lower excitatory rates. At 25 Hz maximum pixel input, increasing stream presentation duration from 25 to 200 ms raised mean accuracy from 75.2% to 90.3%. The experiments do not isolate a causal advantage of gamma timing, measure energy use or test autonomous stream segmentation.
AI use disclosure
AI agents were used to draft, rewrite, restructure and condense this manuscript, including passages of scientific exposition. The lead author specified the intended meaning, directed revisions, corrected wording and interpretation, and repeatedly reviewed the manuscript, including paragraph-by-paragraph review. The lead author exercised editorial judgment over the retained text. Following review and approval by all authors, the final manuscript reflects the scientific account and interpretations they endorse, and all authors take responsibility for its accuracy, claims, citations and conclusions.
Results
Reciprocal coupling creates a gamma-rhythmic low-rate regime
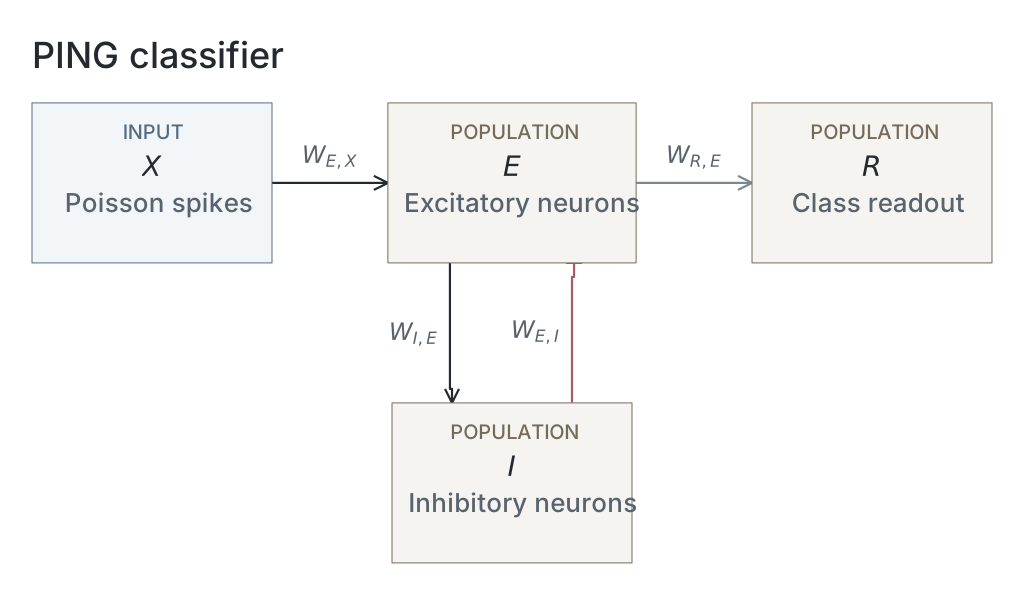
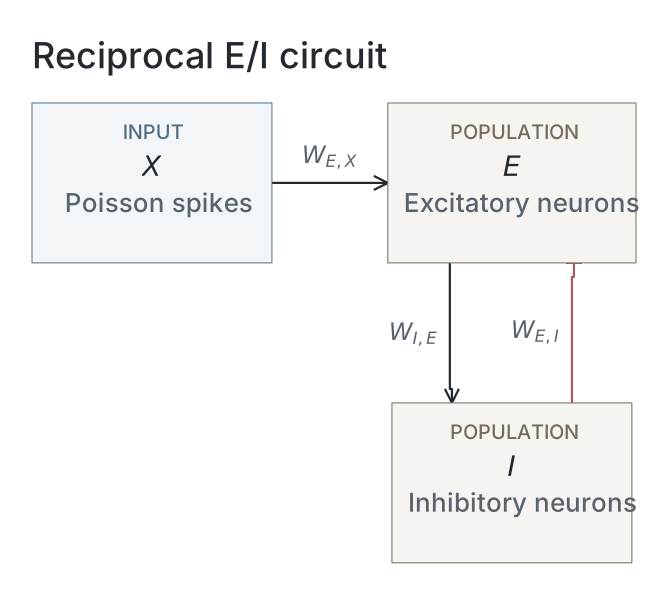
We first asked whether reciprocal excitatory–inhibitory coupling could produce rhythmic population activity while maintaining low firing rates in individual excitatory neurons. We compared untrained conductance-based spiking networks driven by Poisson input, with reciprocal coupling between excitatory (E) and inhibitory (I) populations enabled (loop-on) or disabled (loop-off; Fig. 1A,B). Illustrative 400-ms responses used separately chosen Poisson drives of 5 Hz per channel for loop-off and 45 Hz for loop-on (Fig. 1C,D).

Figure 1: Loop-off and loop-on circuit architecture and activity. (A–B) Loop-off control and reciprocal E→I/I→E loop-on. (C–D) Illustrative 400-ms rasters: 1,024 E neurons (black), 256 I (red), and 1,024 Poisson channels at 5 Hz (loop-off) or 45 Hz (loop-on). (E, G) Mean-subtracted E-population Welch spectra on the same vertical scale; G’s dashed line marks the interpolated peak. (F, H) Mean per-neuron E/I rates over matched 2–100-Hz drive sweeps using the same 1,024-channel networks as the rasters and spectra. Each point is one single-seed trial, without uncertainty estimates; F/H vertical scales differ. Source experiment: exp023 — Turning the PING Loop On.
Loop-off excitatory spikes were dispersed, with silent inhibitory neurons (Fig. 1C); loop-on instead produced recurring E/I volleys and a 56.0-Hz spectral peak with higher-frequency harmonics, which loop-off lacked (Fig. 1D,E,G).
In matched 2–100-Hz drive sweeps on the same 1,024-input networks as the illustrative rasters, loop-off excitatory firing increased from 1.7 to 484.6 Hz while inhibition remained silent. Loop-on excitatory rates were constrained, staying between 1.7 and 11.6 Hz, while inhibitory firing reached 127.5 Hz (Fig. 1F,H).
We next varied the strengths of both directions of the excitatory–inhibitory loop to examine how coupling affected firing rates and rhythmic activity. Across an 11×11 reciprocal-coupling grid, absent E→I or I→E coupling left excitatory firing near 169 Hz and the rhythmicity metric (autocorrelation lobe–trough contrast; Appendix B2) near zero (Fig. 2A–C). With both E→I and I→E pathways present, stronger coupling reduced excitatory firing to single-digit rates, sustained inhibitory firing and increased the rhythmicity metric towards one across a broad region.

Figure 2: Reciprocal-coupling sweep and mean-field onset. (A–C) Mean E rate, I rate and the rhythmicity metric across an 11×11 grid of E→I () and I→E () Gaussian parent means on the fan-in-normalized summed-conductance scale (Appendix A4). Each point represents one untrained network and seed; B’s grayscale is clipped at its 92nd percentile. (D–F) Illustrative 200-ms rasters at , and µS; black/red marks show 160 E/48 I neurons. A–F have no uncertainty estimates. (G–H) Separate four-variable mean-field model. G shows fixed-point eigenvalues across –4 nA (colour), with the leading pair at nA circled in cyan. H shows upward/downward peak-to-peak E-rate amplitudes; the dotted line marks onset. (I) Mean-field onset frequencies (black circles, solid) and median finite-drive spectral peaks from three classifiers per inhibitory decay time in training group TR03 (red squares, dashed), without uncertainty intervals. TR01–TR06 label groups of training regimes (Table 1); TR03 varies inhibitory decay in loop-on classifiers. Methods define measurements and protocols. Source experiments: exp054 — Pinglab Rythmicity Metric, exp117 — Mean-Field Analysis of PING Bifurcations, and exp041 — Firing Rate Tracks Gamma Frequency.
Selected rasters illustrate the same progression (Fig. 2D–F): the rhythmicity metric increased from 0.00030 without coupling to 0.268 at intermediate coupling and 0.989 at strong coupling, as excitatory firing became sparse and inhibitory volleys increasingly regular.
We used a separate four-variable mean-field model to examine how oscillations emerged as external drive increased (Appendix C). Leading complex-conjugate eigenvalues crossed zero real part at nA, corresponding to 27.6 Hz (Fig. 2G). Above onset, excitatory-rate amplitude increased continuously, with nearly coincident upward/downward sweeps and no resolved hysteresis (Fig. 2H). A positive amplitude-squared slope and met the predefined numerical criteria for supercritical onset; criticality was not established analytically.
We then compared how slowing inhibition affected oscillation frequency in the mean-field model and the loop-on classifiers in inhibitory-decay training group TR03. Labels TR01–TR06 identify groups of training regimes, not individual networks or executions (Table 1). Increasing inhibitory decay from 4.5 to 27 ms reduced mean-field onset frequency from 30.2 to 17.9 Hz and median spiking-classifier spectral frequency from 67.3 to 12.2 Hz (Fig. 2I). The mean-field and spiking models showed the same qualitative behaviour—frequency decreased as inhibitory decay slowed. The comparison was intended to assess qualitative behaviour rather than establish quantitative agreement between mean-field onset eigenfrequencies and finite-drive spectral peaks.
The fixed reciprocal loop preserves accuracy at lower excitatory rates
We next trained loop-on and loop-off networks to classify handwritten digits from MNIST using backpropagation through time with surrogate gradients, asking whether reciprocal inhibition could reduce excitatory firing while preserving classification accuracy. In full-MNIST reference group TR01, loop-off and loop-on reached mean final validation accuracies of 95.3% and 91.4%, respectively, with dense loop-off firing and recurring loop-on volleys (Fig. 3A–C). In the separate reduced-pool group TR02, loop-on achieved 89.8% mean test accuracy at a mean excitatory firing rate of 16.6 Hz, versus 90.9% at 88.2 Hz for loop-off: a 5.3-fold firing-rate reduction and 1.1-percentage-point accuracy reduction (Fig. 3D). By adding a spike penalty with progressively lower firing-rate ceilings to both networks, we reduced excitatory firing and classification accuracy, but the networks responded differently. Loop-off firing fell throughout the sweep, accompanied by a steeper loss of accuracy, whereas loop-on firing decreased less at the tightest ceilings while retaining higher accuracy. At the 1-Hz ceiling, loop-on averaged 4.7 Hz and 81.3% accuracy, compared with 2.1 Hz and 63.0% for loop-off. Thus, equal training ceilings did not generally produce matched firing rates. At the 10-Hz ceiling, however, both averaged approximately 9 Hz, with higher accuracy for loop-on (88.6% versus 83.5%).

Figure 3: Accuracy and excitatory firing in loop-off and loop-on classifiers. (A–B) Illustrative 200-ms responses to digit-0 sample 0 from final unpenalised TR01 full-MNIST checkpoints, seed 42; E spikes are black, I red. (C–D) Loop-off: red squares; Loop-on: black diamonds. Means use three independent training replicates. C shows TR01 full-MNIST validation accuracy without uncertainty intervals. A–C use 54,000 optimization and 6,000 validation images. D uses the separate TR02 classifiers trained on 6,300 optimization and 700 validation images and shows final-checkpoint test accuracy versus mean per-neuron E rate under the common post-training evaluation protocol; bars show the standard error of the mean (SEM) on both axes. Ceilings were 1, 2.5, 5, 10 and 25 Hz; stars denote unpenalised conditions. The loop-on 25 Hz ceiling marker nearly coincides with its unpenalised star. Source experiment: exp025 — Inhibition, Accuracy and Firing.
We next asked whether adding reciprocal inhibition after training could produce sparse rhythmic activity while preserving classification accuracy. Adding reciprocal inhibition to the unpenalised TR02 loop-off classifiers without retraining replaced dense excitatory activity with recurring E/I volleys (Fig. 4A,B). Across the coupling sweep, mean excitatory firing fell from 85.9 to 7.2 Hz (11.9-fold), inhibitory firing reached 40.0 Hz, and accuracy fell from 90.4% to 43.2% (Fig. 4C,D). The activity pattern therefore did not require learning with inhibition, but inserting the loop after training incurred a substantial classification cost.

Figure 4: Post-training insertion of reciprocal inhibition. (A–B) Illustrative 200-ms responses to the same digit-7 image from one unpenalised, validation-selected TR02 loop-off classifier (seed 42), at and ; fixed pseudorandom subsets show 200 E neurons (black) and 64 I (red). Learned weights remained frozen; recurrent matrices were newly initialized at each strength without retraining (Methods). (C–D) Mean ± sample standard deviation (SD) across three independent classifiers, evaluated using the common post-training evaluation protocol at –1 in 0.1 steps. C shows per-neuron E/I rates (black circles/red squares); D shows accuracy (grey squares), with the dashed line marking mean accuracy at . Source experiment: exp038 — Switching On the Inhibitory Loop.
Using TR05, we next asked whether the rhythmic activity observed with fixed reciprocal coupling persisted when the recurrent excitatory–inhibitory weights were trained alongside the input and readout weights. Training recurrent weights reduced the rhythmicity metric relative to fixed loop-on recurrence. The final rhythmicity metric was 0.999 with fixed recurrence, versus 0.094, 0.095 and 0.018 when recurrence was trained from standard, one-tenth-standard and zero initialization (Fig. 5C). These means describe three networks per condition responding to one fixed encoding of a reference digit, not test-set variability.
We also compared the recurrent connection weights before and after training. In all three networks in each condition, standard and one-tenth-standard training eliminated most E→I connections; most I→E connections remained positive and their mean strength across all entries increased (Fig. 5D–G). Mean E→I strength fell from standard but rose from one-tenth-standard initialization; zero-initialized recurrence remained zero. Low values of the rhythmicity metric accompanied asymmetric reorganization in these three-replicate comparisons, without identifying a causal weight change.

Figure 5: Epoch-50 activity, probe responses and recurrent weights. TR05 input/readout weights were trained in four conditions: fixed recurrence (Frozen), or recurrence trained from standard (Std.), one-tenth-standard (10%) or zero (Zero) initialization. (A–B) Test accuracy and mean per-neuron E/I rates (black/red) under the common post-training evaluation protocol. (C) Final, non-epoch-smoothed rhythmicity metric from the same fixed digit-0, sample-0 encoding; this probe does not estimate trial-to-trial variability. A–C show means ± SEM across three independent training replicates. (D–E) Pooled positive-weight fractions for E→I/I→E. (F–G) Pooled arithmetic means including zeros, in µS. For each direction, condition and time point, the pool contains 786,432 entries from three equal-sized complete matrices, giving each network equal weight. Wide grey/narrow red bars denote initialization/epoch 50. Error bars show ±1 SEM across the three per-network statistics (sample SD divided by ), calculated separately before and after training; they do not describe uncertainty in the paired change. Individual weights are not independent training replicates. Arrows mark pooled relative changes ≥5%, not statistical significance. Source experiment: exp049 — Recurrent Learning Weakens Rhythmicity.
Excitatory firing is organised by population-cycle participation
We next trained the separate TR03 loop-on networks at each inhibitory decay time to examine how the timescale of inhibition shaped population rhythms, excitatory firing and classification accuracy. Across inhibitory decay times of 4.5–27 ms, mean spectral frequency fell from 67.5 to 11.7 Hz and excitatory firing from 18.3 to 2.8 Hz (Fig. 6A). The affine fit to six condition means had slope 0.285 Hz/Hz, intercept −0.70 Hz and . Mean test accuracy fell from 91.2% to 81.9% (Fig. 6B). Slower rhythms thus accompanied lower activity and a classification cost. The slowest condition lay below conventional gamma frequencies, so we describe the full sweep as population cycles rather than gamma cycles.[1]

Figure 6: Excitatory firing and spike counts per cycle across inhibitory decay times. The eighteen TR03 epoch-50 classifiers comprise three independent replicates per decay time, evaluated with the common post-training evaluation protocol. (A–B) Mean per-neuron E rate and test accuracy versus spectral-peak frequency , estimated from the largest interpolated 5–150-Hz peak of each network’s trial-averaged Welch spectrum. Points and both-axis bars show means ± SEM across replicates. Labels give decay times; A’s red dashed line is the equal-weight affine fit to six condition means. B’s dotted line marks 10% chance accuracy. (C–H) Equal-network mean fractions of E neuron–cycle pairs with 0, 1, 2 or ≥3 spikes at decay times 4.5, 6, 9, 12, 18 and 27 ms. Black bars show arithmetic means of the three networks’ separately normalized distributions, giving each network equal weight regardless of its detected cycle total; no uncertainty intervals are shown. Cycles span midpoints between detected inhibitory bursts, with edge intervals extending to presentation boundaries (Methods). Presentations without bursts are excluded. These distributions reuse the same classifiers’ recorded spikes without new inference or training. Source experiments: exp041 — Firing Rate Tracks Gamma Frequency and exp046 — One Spike per Gamma Cycle.
To examine how individual neurons participated in these population rhythms, we counted each excitatory neuron’s spikes in TR03 classifiers within cycles defined by successive inhibitory bursts. Across the 18 equally weighted networks, the mean fractions were 76.35% with no spikes, 22.09% with one spike and 1.56% with two or more: 98.44% contained at most one spike (Fig. 6C–H). These distributions support predominantly one-spike participation among active neurons alongside widespread within-cycle silence, without establishing a strict firing ceiling or constant participating fraction.
The operating regime has asymmetric perturbation sensitivity
We next tested how the unpenalised TR02 loop-on and loop-off classifiers responded to disrupted spike transmission by deleting naturally generated spikes or inserting additional spike events during inference. Both networks maintained high accuracy when 80% of excitatory and inhibitory spike transmissions were randomly deleted: 88.9% for loop-off and 89.2% for loop-on. Deleting all transmissions reduced both to 10.6% (Fig. 7A). Adding extra spikes had a larger effect on loop-on networks. When spikes were added to both populations at each network’s baseline excitatory firing rate, accuracy fell to 76.4% for loop-off and 38.5% for loop-on. Doubling the rate of added spikes reduced accuracy further, to 53.1% and 11.4%, respectively (Fig. 7B). Loop-on therefore tolerated substantial deletion but was more sensitive to insertion at matched baseline-relative doses.

Figure 7: Spike perturbations in trained classifiers. (A–B) Inference-time perturbations of validation-selected unpenalised TR02 loop-off (red squares) and loop-on (black diamonds), without retraining, using the common post-training evaluation protocol. Lines and shading show mean ± sample SD across three independent training replicates; dashed lines mark 10% chance accuracy. (A) Independent deletion of transmitted E/I spikes, preserving neuronal resets. (B) Independent insertion into both populations at 0–200% of each network’s unperturbed E firing rate; aggregation matches relative doses, not hertz. The same nominal per-neuron insertion rate applies to E and I. Collisions add no event; inserted events cause no reset or refractory period. Both interventions affect readout and recurrent transmission. Exact dose grids and operations are given in Methods. Source experiment: exp037 — Dropped Spikes vs Added Noise.
We next tested how inhibitory spike timing affected the unpenalised TR02 loop-on classifiers by artificially shifting and replaying recorded inhibitory spikes while preserving each neuron’s spike count within every presentation. Shifting each inhibitory spike separately reduced excitatory firing. Shifting all inhibitory spikes from the same fixed 22.8-ms time window together increased it (Fig. 8). At a proposed jitter standard deviation of 14 ms, independent shifts reduced mean excitatory firing from 16.6 to 0.0075 Hz and accuracy from 89.8% to 11.9%; group shifts increased firing to 68.3 Hz while accuracy declined to 82.5%. Replayed inhibitory firing remained 108.3 Hz. Thus, timing altered excitatory recruitment despite preserved inhibitory counts.

Figure 8: Count-preserving inhibitory replay perturbations. Recorded inhibitory spikes replace naturally generated outputs; excitatory activity and readout responses are recomputed with unchanged weights and inputs. (A–B) Illustrative digit-7 responses (test sample 0, seed 42) at proposed Gaussian-shift SD ms, showing the same 200 E neurons (black) and 64 replayed I neurons (red). (A, C) Independent-spike jitter. (B, D) Shared shifts within fixed 22.8-ms clock windows, defined independently of detected bursts. Grid rounding, reflection and collision handling preserve each neuron’s count (Appendix D). (C–D) Per-neuron E/I rates (black circles/red squares, left axes) and test accuracy (grey squares, right axes), averaged across three unpenalised TR02 loop-on final-checkpoint classifiers using the common post-training evaluation protocol; no uncertainty intervals. Displayed jitter values are 0, 0.5, 1, 2, 5, 9, 14 ms (C) and 0, 1, 3, 7, 14 ms (D); both share the zero-jitter replay control. Source experiment: exp042 — Inhibitory Replay and E Firing.
Accuracy across simulation timesteps
We next examined whether classification performance depended on the simulation timestep by comparing the TR04 loop-on classifiers trained separately at each tested timestep.
Mean test accuracy ranged from 88.37% to 89.63% across the twelvefold timestep range (Fig. 9). Mean excitatory firing was 14.27 Hz at the finest timestep and 17.02 Hz at the coarsest. Classification performance therefore persisted across the tested resolutions, while excitatory activity remained slightly timestep-dependent. Because each network was trained and evaluated at the same timestep, this comparison combines timestep effects during training and evaluation; it does not establish numerical convergence with fixed weights.

Figure 9: Timestep dependence after separate training. TR04 classifiers were trained separately at each timestep. Mean per-neuron excitatory firing rate (black diamonds, left axis) and test accuracy (red squares, right axis) versus integration timestep on a logarithmic horizontal axis. Points show means across three independently trained loop-on classifiers per timestep (seeds 42–44); error bars indicate ±1 SEM. Epoch-50 checkpoints were evaluated at their training timestep on the same 1,000 MNIST test images. Firing rates use realised presentation durations: 199.8 ms at 0.3 and 0.6 ms, and 200 ms otherwise. Source experiment: exp044 — Firing Rate Across the Timestep Sweep.
Loop-on networks classify continuously presented inputs
We next tested whether loop-on classifiers could classify successive images while carrying their hidden state from one presentation to the next. A TR06 loop-on classifier trained across variable input rates correctly classified five successive digits presented at changing durations and input rates (Fig. 10A). Sparse excitatory firing (Fig. 10B) and inhibitory volleys (Fig. 10C) persisted throughout the stream. The readout accumulated spike-count evidence during each presentation (Fig. 10D). We selected an example in which all five digits were classified correctly; the first candidate met this criterion. The example therefore demonstrates feasibility, not reliability across arbitrary streams. Output state and counts reset at supplied boundaries, so this result does not establish autonomous boundary detection. We then evaluated streaming accuracy across different presentation durations and input strengths, using repeated trials to assess performance beyond the illustrative example. At 25-Hz maximum-pixel input, increasing duration from 25 to 200 ms raised mean accuracy from 75.2% to 90.3% (Fig. 10E). At 200 ms, increasing input from 0.5 to 5 Hz raised accuracy from 26.3% to 82.7% (Fig. 10F). Mean accuracy then increased across the tested rates from 5 to 25 Hz, reaching 90.3%. Brief presentations and weak drive constrained performance. The grid paired image identity and order across conditions; its uncertainty remains conditional on one sampled image bank.

Figure 10: Spike-count classification in continuous MNIST streams. The three validation-selected TR06 loop-on classifiers used variable-rate training (0.5–25 Hz). During inference, hidden E/I state continued between digits; output voltage/counts reset at supplied boundaries. (A–C) Reused illustrative seed-42 stream selected by a predefined five-correct criterion: digits 1, 7, 9, 5, 2 at duration–rate pairs (100 ms, 5 Hz), (200 ms, 7.5 Hz), (50 ms, 25 Hz), (100 ms, 15 Hz), (200 ms, 10 Hz). A shows images, labels and conditions; B/C show the first 200 E/64 I neurons (black/red). Dotted lines mark supplied boundaries. (D) Softmax-normalized cumulative output-spike counts: true class red, others grey. Shares are not calibrated probabilities; the dashed 0.5 line is not a decision threshold. Classification uses the largest final count (Methods). (E–F) Repeated quantitative evaluation on the same 40 ordered five-image streams for every network, duration and rate, with separate spike-encoding draws. Accuracy across 40 five-digit test streams per network/condition (200 decisions), with duration/rate fixed within each stream. E shows replicate-mean percentage accuracy at four durations and eleven rates, without uncertainty intervals. F reuses the 200-ms evaluations: mean ± SEM across three replicates on a logarithmic rate axis. The illustrative recording was selected separately from this grid. Source experiment: exp082 — Spike-Count Stream Classification.
Methods
Experimental design
We combined untrained circuit experiments, a mean-field calculation and trained MNIST classifiers to examine how reciprocal excitatory–inhibitory coupling shapes population rhythms, excitatory firing and classification. In untrained circuits, we compared loop-off and loop-on responses across input strengths and mapped the effects of reciprocal coupling strength; the mean-field model examined oscillatory onset and its dependence on inhibitory decay time. Classifier experiments compared accuracy and firing under activity penalties, tested the effects of enabling reciprocal coupling during inference without retraining and of recurrent-weight training, and examined inhibitory timescales and cycle participation. We also measured sensitivity to spike deletion, spike insertion and inhibitory timing perturbations, assessed timestep dependence, and evaluated continuous image streams. Table 1 summarizes the designs, defines training groups TR01–TR06 and identifies classifier reuse.
| Training Group | Figures | Description |
|---|---|---|
| Untrained circuits | 1 | Loop-off/on input-strength sweep; 1,024 E and 256 I neurons. No training, data split or checkpoint. |
| Untrained circuits | 2A–F | Reciprocal coupling-strength grid; 1,024 E and 256 I neurons. No training, data split or checkpoint. |
| Mean-field model | 2G–I¹ | Deterministic mean-field onset analysis across external drive and inhibitory decay times. No training, data split or checkpoint. |
| TR01 | 3A–C | 3 × 2 full-MNIST loop-off/on references; no activity penalty. 54,000 optimization / 6,000 validation images; mean pre-reset-state readout. Final checkpoints for rasters; all training epochs for validation curves. |
| TR02 | 3D | 3 × 12 loop-off/on classifiers: penalty off or ceilings of 1, 2.5, 5, 10, 25 Hz per architecture. 6,300 optimization / 700 validation images; mean pre-reset-state readout; final checkpoints. |
| TR02 | 4 | 3 × 1 unpenalised loop-off classifiers reused without retraining. Inference loop strength 0–1 in 0.1 steps. Original split: 6,300 optimization / 700 validation images; mean pre-reset-state readout; best-validation checkpoints (epoch 46 for all three seeds). |
| TR05 | 5 | 3 × 4 classifiers: recurrence fixed at strength 1 or trainable from 1, 0.1, 0; zero initialization disabled the loop. No activity penalty. 6,300 optimization / 700 validation images; mean pre-reset-state readout; final checkpoints. |
| TR03 | 6 2I² | 3 × 6 loop-on classifiers at inhibitory decay times 4.5, 6, 9, 12, 18, 27 ms; no activity penalty. 6,300 optimization / 700 validation images; mean pre-reset-state readout; final checkpoints. Recorded spikes reused for cycle participation. |
| TR02 | 7A–B | 3 × 2 unpenalised loop-off/on classifiers reused for spike deletion/insertion across doses, without retraining. Original split: 6,300 optimization / 700 validation images; mean pre-reset-state readout; best-validation checkpoints (loop-off epochs 46, 46, 46; loop-on epochs 50, 43, 50). |
| TR02 | 8 | 3 × 1 unpenalised loop-on classifiers reused for independent-spike and grouped inhibitory timing shifts, without retraining. Original split: 6,300 optimization / 700 validation images; mean pre-reset-state readout; final checkpoints. |
| TR04 | 9 | 3 × 5 loop-on classifiers at timesteps 0.05, 0.1, 0.2, 0.3, 0.6 ms; no activity penalty. 6,300 optimization / 700 validation images; mean pre-reset-state readout; final checkpoints. |
| TR06 | 10 | 3 × 1 loop-on classifiers; per-presentation maximum-pixel rates sampled from 0.5, 0.75, 1, 1.5, 2, 3, 5, 7.5, 10, 15, 25 Hz; no activity penalty. 6,300 optimization / 700 validation images. Continuous-stream duration/rate sweep; readout: accumulated output spike counts; best-validation checkpoints (epochs 49, 46, 49). |
Experimental design, training groups and classifier reuse. E/I: excitatory/inhibitory neurons. TR01–TR06 identify groups of training regimes, not individual executions. Classifier counts are three seeds (42–44) × distinct training regimes; the six groups comprise 90 distinct classifiers. All groups completed 50 epochs with nominally 200-ms isolated-image presentations. Unless varied in the table, maximum-pixel input rate was 25 Hz, integration timestep 0.1 ms and inhibitory decay 6 ms; classifier recurrence was fixed at standard strength (E→I and I→E Gaussian parent means of 1 and 2 µS, respectively, before fan-in normalization) in loop-on networks and absent in loop-off networks. Only input and readout weights were trained except in the trainable-recurrence conditions of TR05. Both readout modes used spiking output units. Untrained circuit conditions used one trial with seed 42; mean-field calculations were deterministic. Final: epoch 50. Epoch lists are ordered by seeds 42, 43 and 44. Best validation: lowest mean validation cross-entropy across three encoding draws, with ties resolved by higher accuracy, then earlier epoch. Shared optimization and neuronal parameters are specified below and in Appendix A. ¹ Mean-field results. ² Spiking-model results.
Spiking networks
Hidden excitatory and inhibitory neurons followed conductance-based leaky integrate-and-fire dynamics:
Here, is membrane voltage and is time. Membrane capacitance was 1 nF for excitatory neurons and 0.5 nF for inhibitory neurons; leak conductance was 0.05 and 0.1 µS, respectively. The leak reversal potential was −65 mV, while excitatory and inhibitory reversal potentials and were 0 and −80 mV. Synaptic conductances and varied with incoming spikes, as described below. At the spike threshold mV, neurons emitted a spike and returned to the reset potential mV. Voltage remained at reset for an absolute refractory period of 1.2 ms in excitatory neurons and 0.6 ms in inhibitory neurons.
Synaptic conductances decayed exponentially and increased upon incoming spikes:
Here, is conductance at step , the conductance increment from source , and its delivered spike indicator. Decay times were ms and ordinarily ms. Exponential-Euler voltage integration used ms, except in the timestep study (Fig. 9). The inhibitory-timescale grid is specified below; exact updates and transmission ordering are in Appendix A1.
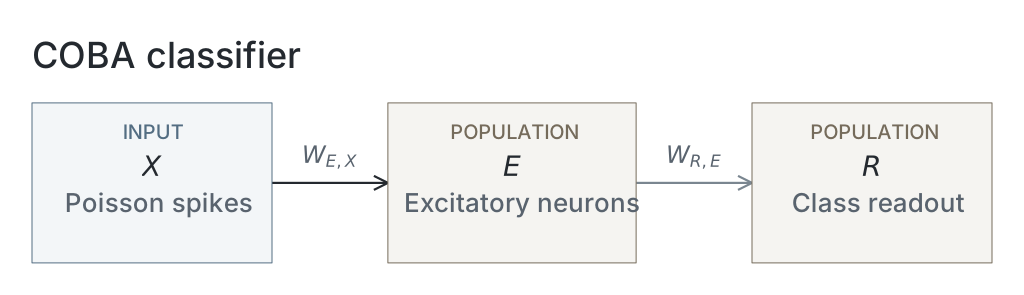
Classifier networks in TR01–TR06 contained input→E, E→I, I→E and E→output projections, with E→E and I→I connections disabled; loop-off additionally disabled reciprocal E–I coupling. Input and recurrent weights used lower-clamped Gaussian draws with fan-in normalization (Appendix A4 Table A1). Here, is the presynaptic population size; input weights were initially zeroed with probability but remained trainable. Readout weights were dimensionless and initialized directly without fan-in normalization.
Untrained circuit experiments
We compared untrained loop-off and loop-on circuits containing 1,024 excitatory and 256 inhibitory neurons (Fig. 1). Reciprocal E→I and I→E coupling was absent in loop-off and enabled in loop-on, using the initialization parameters specified in Table A1. Each simulation lasted 400 ms at a 0.1-ms timestep, beginning with membrane voltages of −65 mV and zero synaptic conductances; no burn-in interval was discarded. Illustrative rasters used 1,024 independent Poisson input channels at 5 Hz per channel for loop-off and 45 Hz for loop-on. The matched input–output sweeps reused the same 1,024-input networks and fixed weights within each loop condition, testing both architectures at 2, 5, 10, 20, 40, 70 and 100 Hz per channel. Each architecture–input condition comprised one trial with seed 42. Population firing rates were measured over the full trial, and spectra were calculated from the illustrative raster trials as described below.
We mapped reciprocal coupling in untrained networks containing 1,024 excitatory and 256 inhibitory neurons (Fig. 2A–F). Each excitatory neuron received its own independent 100-Hz input channel through a fixed input weight of 0.5 µS. The E→I initialization parent mean ranged from 0 to 3 µS in 0.3-µS increments, and the I→E parent mean ranged from 0 to 6 µS in 0.6-µS increments, forming an grid. Recurrent weights used Gaussian draws with parent standard deviations equal to 10% of their respective parent means, followed by lower clamping at zero and division by presynaptic population size. Each grid condition comprised one network and one trial with seed 42. Simulations lasted 1 s at a 0.1-ms timestep, with an inhibitory decay time of 6 ms. We discarded the first 100 ms and measured population firing rates and the excitatory-population rhythmicity metric (autocorrelation lobe–trough contrast) over the remaining 900 ms. Illustrative rasters show the first 200 ms after burn-in at three selected grid conditions.
Activity measurements
Mean per-neuron firing rates in Fig. 1F,H, Fig. 2A,B, Fig. 3D, Fig. 4C, Fig. 5B, Fig. 6A, Fig. 9 and Fig. 8C,D were calculated as
where is the firing rate of population , is its total spike count, is its neuron count and is the observation duration in seconds, summed across presentations when pooling trials.
For spectral analysis, we formed each presentation’s excitatory-population trace by averaging binary spike indicators across neurons at each simulation step. We subtracted the trace mean and estimated its power spectral density using Welch’s method with a single Hann window spanning the full presentation. For the inhibitory-timescale classifiers in Fig. 2I and Fig. 6A, spectra were averaged across the 1,000 test presentations within each network before locating the largest peak between 5 and 150 Hz. The spectral-peak frequency was refined by parabolic interpolation (Appendix B1). The 200-ms presentations gave a frequency-bin spacing of 5 Hz.
The illustrative spectra in Fig. 1E,G instead used individual 400-ms trials, giving 2.5-Hz bin spacing. Their peak annotation additionally required inhibitory spiking; absence of a marker was not a statistical test for rhythmicity. Interpolation formulas and boundary cases are specified in Appendix B.
We quantified excitatory-population temporal structure using the rhythmicity metric (Fig. 2C and Fig. 5C). Spikes were pooled across excitatory neurons into 1-ms count bins. We normalized and smoothed the uncentered autocorrelogram over lags up to 100 ms as specified in Appendix B2.
We identified the first local minimum at a lag of at least 2 ms and the maximum at positive lags preceding that minimum. The rhythmicity metric was defined as
Here, is the dimensionless rhythmicity metric, and and are the preceding maximum and first minimum of the smoothed autocorrelation. The coupling-grid rhythmicity metric used the 900-ms post-burn-in interval; the classifier rhythmicity metric used the fixed reference-image presentation below. Appendix B specifies the feature-selection and boundary rules.
Mean-field calculation
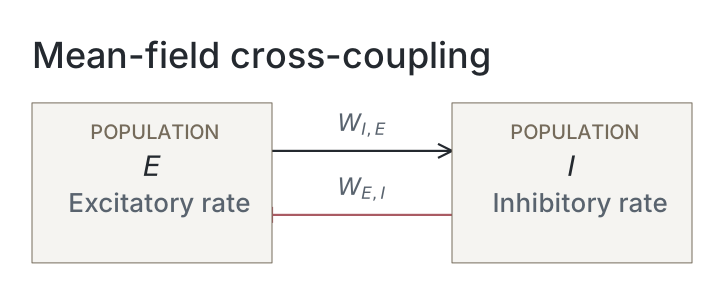
We examined oscillatory onset using a separate four-variable mean-field model (Fig. 2G–I). Its state comprised excitatory and inhibitory population rates and , excitatory conductance onto inhibitory neurons , and inhibitory conductance onto excitatory neurons :
Here, dots denote derivatives with respect to time in milliseconds; rates were expressed in and conductances in µS. The external current , measured in nA, drove only the excitatory population. The functions and mapped mean input current to steady-state firing rate using noisy leaky integrate-and-fire gains.
The rate-relaxation constants ms and ms matched the respective membrane time constants. Synaptic decay constants were ms and, unless varied, ms. Fixed driving-force magnitudes were mV and mV; summed conductance increments were µS and µS. The gains used the leak, reset and threshold parameters specified above, refractory periods ms and ms, and an effective voltage-noise scale mV.
This phenomenological closure fixed synaptic driving forces at rest, omitted conductance-dependent shunting and assumed a noise scale that was neither measured nor fitted to spiking activity. The population equations were deterministic; noise entered through the gain functions. The gain integral and closure assumptions are specified in Appendix C.
We continued fixed points across external currents –4 nA and located onset at , where the leading complex-conjugate eigenvalue pair first crossed from negative to nonnegative real part (Fig. 2G). Eigenvalues came from the continuous-time Jacobian of the four-variable model; continuation and refinement details are given in Appendix C2. The onset frequency was
Here, is either eigenvalue of the refined crossing pair and denotes its imaginary part in radians per millisecond; is in hertz. The factor 1000 converts cycles per millisecond to hertz. Numerical settings are specified in Appendix C.
We assessed criticality with 2-s upward/downward drive integrations, measuring peak-to-peak E-rate amplitude in over the final 500 ms at 1,001 fixed sample times (Fig. 2H). Numerical supercriticality required no resolved hysteresis and a positive amplitude-squared slope, using Appendix C’s predefined thresholds. No first Lyapunov coefficient was calculated, so narrower bistability or an unstable periodic orbit was not excluded. We repeated onset refinement at the six inhibitory decay times used for spiking classifiers, holding other mean-field parameters fixed. Fig. 2I compares the mean-field Hopf eigenfrequency with the median finite-drive spectral-peak frequency across three spiking classifiers per decay time.
Classifier training
We defined six training groups, TR01–TR06, by architecture, data partition, readout and varied training settings (Table 1). Each label identifies a group of training regimes, not an individual network or execution. Frequency and cycle-participation measurements reused TR03; loop-insertion and spike-perturbation experiments reused unpenalised TR02 classifiers. Unless specified otherwise, trained-network evaluations used the common post-training evaluation protocol below.
For trained-network comparisons, the unit of replication was one separately initialized and trained network, with three replicates per condition (seeds 42–44). These seeds controlled network initialization and, for TR06 variable-rate training, the sampling of input rates. The training-data split and post-training evaluation test-image subset were fixed separately. Repeated interventions on a network were repeated measurements; individual weights, neurons, presentations and neuron–cycle pairs were not additional network replicates.
Each network’s outcome was calculated before aggregation across networks. Sample SD used the denominator , and SEM was calculated as , where is the number of training replicates.
MNIST images were flattened into 784-element vectors and their pixel intensities divided by 255. For the six TR01 reference classifiers in Fig. 3A–C, we used the full official 60,000-image training partition, divided into 54,000 optimization images and 6,000 validation images using a class-stratified split. For the remaining 84 classifiers in TR02–TR06, we sampled 7,000 images uniformly without replacement from the same official partition and split them into 6,300 optimization and 700 validation images. Sampling and class-stratified splitting used seed 42, giving fixed data partitions across training replicates within each group. TR02 included both penalised and unpenalised classifiers. Loop-insertion and spike-perturbation experiments reused unpenalised TR02 classifiers without retraining. The official 10,000-image test partition remained separate from optimization and checkpoint selection. Post-training evaluations in Figs. 3–9 used a common subset of 1,000 test images sampled uniformly without replacement using seed 42, without class stratification. This subset and its presentation order were fixed independently of training seed. Single-image probes and illustrative rasters used separately specified examples; continuous-stream evaluations sampled from the full official test partition, as described below.
Each normalized pixel drove an independent Bernoulli spike channel:
Here, indicates an input spike from pixel at timestep , is its normalized intensity, and is its per-step spike probability. The maximum-pixel rate was ordinarily 25 Hz, and the integration timestep is expressed in seconds in this equation. Draws were independent across pixels, timesteps and presentations, with at most one spike per channel per step.
Independent image presentations lasted nominally 200 ms and began with freshly initialized hidden and output states. Training generated fresh encoding draws on each presentation. Spike encodings used for post-training evaluation were matched across networks at common input settings, with independent perturbation randomness (Appendix B5). Variable input rates and state continuity between successive images in the streaming experiment are described below.
All classifiers in TR01–TR06 had ten dimensionless, current-based spiking leaky integrate-and-fire output units, one per digit class. Exponential decay and input integration followed standard leaky integrate-and-fire theory.[2] The input normalization and immediate subtractive reset specified our implemented readout convention. Their E→output synapses delivered weighted excitatory spikes directly, without a separate synaptic decay state or a conductance-dependent driving force. The pre-reset output state followed
Here, denotes the digit class, the simulation-step index, the dimensionless state retained after reset and its pre-reset value. The dimensionless weight connects hidden excitatory neuron to output class , and denotes its spike delivered in that step. The decay factor is , with output decay time ms and integration timestep ; specifies the dimensionless timestep scaling of the input. A pre-reset state at or above the dimensionless threshold produced one spike, after which the threshold was subtracted from the state:
Here, is the output spike indicator, and equals one when its condition holds and zero otherwise. Output units had no refractory period and began each independent presentation at zero.
For TR01–TR05 classification (Figs. 3–9), we scored classes using the mean pre-reset state of these spiking units, rather than their emitted spike counts. Class logits and predictions were
Here, is pre-reset output state at step , the presentation’s step count, the class logit and the predicted digit. The mean-state readout retained the output units’ spike generation and subtractive reset. Exact output updates are in Appendix A2; TR06 classifiers instead used the spike-count readout described below.
All 90 included classifiers completed 50 training epochs using AdamW with learning rate , zero weight decay and minibatches of 256 images. The objective was mean cross-entropy, supplemented by the activity penalty described below where applicable. We used full, untruncated surrogate-gradient backpropagation through the complete temporal unrolling of every presentation in each minibatch.[3] Before each optimizer update, we clipped the global Euclidean gradient norm to a maximum of 1. Trainable connection weights were subsequently clamped below at zero.
Spikes remained binary during forward simulation. During backpropagation, the threshold derivative was replaced by the fast-sigmoid surrogate
where is the spike indicator, is the numerical distance from threshold—expressed in millivolts for hidden neurons and normalized units for output neurons—and the surrogate slope . Gradients through each hidden excitatory and inhibitory membrane increment were additionally divided by the dimensionless voltage-gradient damping divisor in both loop-on and loop-off. Damping altered backward derivatives, not the forward update rule; output updates were undamped. Exact gradient paths are specified in Appendix A3.
After each training epoch, we evaluated the corresponding validation partition—6,000 images for TR01 and 700 for TR02–TR06—using three independently seeded spike-encoding draws. The same encoding seeds were reused across epochs, keeping stochastic inputs fixed for checkpoint comparisons. For TR06 classifiers, validation input-rate draws were also fixed across epochs. Cross-entropy and accuracy were averaged over validation images and encoding draws; the activity penalty was excluded from the validation loss.
Best-validation checkpoints minimized mean validation cross-entropy over epochs 1–50, with ties resolved by higher accuracy, then earlier epoch. Final checkpoints were from epoch 50. Table 1 specifies the checkpoint used for each analysis.
Classifier comparisons and recurrent coupling
For the accuracy–rate comparison (Fig. 3D), we added a one-sided quadratic penalty to the classification loss:
Here, is the objective, mean classification cross-entropy, the minibatch size and the presentation index. The excitatory rate is that presentation’s excitatory spike count divided by excitatory population size and duration in seconds. Division by makes the excess dimensionless. We used dimensionless penalty coefficient at ceilings of 1, 2.5, 5, 10 and 25 Hz; the unpenalised condition used . The penalty acts on each presentation before minibatch averaging and imposes no hard rate limit. Only input/readout weights were trained; recurrence stayed fixed, enabled in loop-on and disabled in loop-off.
We compared loop-off and loop-on under the six activity conditions defined above, giving 36 reduced-pool networks in TR02 (Fig. 3D). Final-checkpoint test accuracy and excitatory firing rates used the common post-training evaluation protocol and were summarized as means and SEM across three training replicates per condition. Separately, the six TR01 full-MNIST reference classifiers supplied the illustrative rasters and validation learning curves (Fig. 3A–C). Learning curves averaged three replicate accuracies at each epoch without uncertainty intervals; illustrative-example selection is specified in Appendix B4.
The accuracy–rate, loop-insertion and spike-perturbation evaluations used the 18 TR02 loop-off classifiers trained with , together with the corresponding loop-on classifiers where applicable (Fig. 3, Fig. 4 and Fig. 7). The remaining classifier measurements used the networks and evaluation protocols specified in Table 1.
We inserted reciprocal inhibition into the three unpenalised TR02 loop-off classifiers, holding learned input and readout weights fixed without retraining (Fig. 4).
The dimensionless loop strength ranged from 0 to 1 in increments of 0.1. At each strength, we newly initialized the E→I and I→E matrices from Gaussian distributions with parent means µS and µS, respectively, and parent standard deviations equal to 10% of each parent mean. We clamped negative draws to zero and divided weights by the presynaptic population size: 1,024 for E→I and 256 for I→E. Thus, disabled the loop and used the standard recurrent initialization.
At each strength, we measured post-training test accuracy and E/I firing rates, summarized as means and sample SD across the three reused classifiers.
We compared fixed recurrence at standard strength with trainable recurrence initialized at , or (Fig. 5), giving 12 networks in TR05. All conditions trained input and readout weights without an activity penalty. Post-training test accuracy and E/I firing rates used the common protocol. These outcomes and the rhythmicity metric were summarized as means and SEM across three training replicates per condition. The rhythmicity metric used the final training diagnostic from one 200-ms encoding of the first official-test digit-0 image, generated with seed 0 and fixed across networks, without smoothing across epochs.
For TR05 recurrent-weight comparisons, initial matrices were reconstructed using the original initialization seeds and parameters. At initialization and epoch 50, we pooled the three complete matrices separately for each connection direction and condition, giving 786,432 entries per pooled distribution. We calculated the fraction of strictly positive weights and the arithmetic mean weight across all entries, including zeros. Because the three matrices had equal size, each network contributed equally to these pooled summaries. We also calculated the same two statistics separately for each network and calculated their SEM across the three networks, separately at initialization and epoch 50. These were descriptive summaries, without significance tests of training-induced weight changes. Jointly trained weights within a matrix were not independent training replicates.
Inhibitory timescale and cycle participation
TR03 comprised 18 separately trained loop-on classifiers at inhibitory decay times and ms (Fig. 6A–B). Input and readout weights were trained without an activity penalty; recurrence remained fixed at standard strength. Evaluation retained each assigned decay time and measured post-training test accuracy, excitatory firing rate and spectral-peak frequency using the common protocols. Fig. 6A–B summarizes these outcomes as means and SEM across the three training replicates at each decay time.
We fitted the affine relationship
by ordinary least squares, giving equal weight to each of the six condition means. Here, and are the across-replicate mean excitatory firing rate and spectral-peak frequency, both in hertz; is the fitted intercept in hertz and is the dimensionless fitted slope. Fit quality was quantified by the coefficient of determination , using the centered total sum of squares. The mean-field comparison in Fig. 2I used medians of the same three per-network frequencies at each decay time.
We reused the TR03 classifiers’ recorded spikes to measure excitatory counts per cycle (Fig. 6C–H), without new inference or training. Inhibitory bursts were detected from smoothed population counts with peak separation scaled to each network’s spectral period (Appendix B3).
Cycle boundaries were midpoints between inhibitory-burst peaks, with edge intervals extending to presentation boundaries. Presentations without bursts were excluded. Each excitatory neuron–cycle pair was classified as containing 0, 1, 2 or ≥3 spikes. We normalized each network’s four counts separately across its presentations and averaged its fractions equally with the other two networks in its condition, or across all 18 networks for the overall summary. This gave each network equal weight irrespective of its detected cycle total and balanced the six decay conditions in the overall summary. These equal-network distributions were descriptive means without uncertainty intervals. Neither the distributions nor the rate–frequency fit treated neuron–cycle pairs as independent replicates. Appendix B specifies discretization and single-burst conventions.
Cycle-participation analysis excluded twelve of 18,000 presentations without detected inhibitory bursts, all from the TR03 seed-43 network at 27-ms inhibitory decay. Weak image inputs, comparatively weak input connections and low firing rates left excitatory activity too dispersed to recruit inhibition. The same images recruited inhibition in other replicates, suggesting an interaction between stimulus strength, network properties and stochastic encoding.
Spike perturbations
We separately applied deletion and insertion to the six unpenalised TR02 loop-off and loop-on classifiers without retraining (Fig. 7A–B), using the common post-training evaluation protocol and matched input encodings across perturbation conditions. Outcomes were summarized as means and sample SD across three training replicates per architecture.
Deletion independently suppressed each naturally generated excitatory or inhibitory spike with probability , preserving the neuronal reset and refractory period associated with that spike.
For insertion, we first measured each network’s unperturbed mean per-neuron excitatory firing rate, , across the complete test subset. The nominal per-neuron insertion rate was , where the dimensionless dose . Independent Bernoulli events were sampled for every excitatory and inhibitory neuron at each timestep, with probability equal to the insertion rate in hertz multiplied by the timestep in seconds. The same nominal insertion rate applied to both populations. Transmission was capped at one spike per neuron per timestep, so insertion coinciding with an existing spike added no event. Inserted events triggered neither resets nor refractory periods.
Modified events supplied the readout and subsequent recurrent transmission. Insertion conditions were aggregated at matched baseline-relative doses.
We applied two count-preserving inhibitory replay perturbations to the three unpenalised TR02 loop-on classifiers (Fig. 8). Unperturbed inhibitory spikes recorded under the common post-training evaluation protocol were shifted and replayed, replacing naturally generated inhibitory outputs while excitatory activity and readout responses were recomputed with unchanged weights and identical inputs.
For the conditions reported in Fig. 8, independent-spike jitter assigned each inhibitory event a zero-mean Gaussian offset with standard deviation or ms. Group jitter assigned one shared Gaussian offset to all inhibitory events originating within each fixed 22.8-ms window of a presentation, using or ms. These windows comprised 228 simulation steps and were defined independently of detected bursts.
Each inhibitory neuron’s spike count was preserved within every presentation. The parameter describes proposed offsets before boundary and collision adjustments; both arms shared the zero-jitter replay control. Exact transformations are specified in Appendix D.
We measured post-training test accuracy and excitatory and replayed inhibitory rates, reporting means across three reused classifiers without uncertainty intervals. Delivered inhibition could not respond to ongoing excitatory activity.
Simulation timestep comparison
We compared the 15 separately trained TR04 loop-on classifiers (Fig. 9): three training replicates (seeds 42–44) at each integration timestep of 0.05, 0.1, 0.2, 0.3 and 0.6 ms. All networks underwent 50 training epochs without an activity penalty, with recurrent weights fixed at standard strength. Excitatory and inhibitory refractory periods remained 1.2 and 0.6 ms, respectively, corresponding to integer step counts throughout.
Each epoch-50 checkpoint was evaluated at its training timestep on the common 1,000-image test subset. Nominally 200-ms presentations were truncated to complete simulation steps, giving realised durations of 199.8 ms at 0.3 and 0.6 ms and 200 ms otherwise. Mean per-neuron excitatory firing rates included all excitatory neurons and test presentations, using the realised duration. Accuracy and firing rate were summarised as means and SEM across the three training replicates at each timestep.
Continuous streams
To identify input rates that retained enough digit information for classification, we encoded MNIST pixels as stochastic spikes and filtered each pixel’s events through synaptic conductance and a non-spiking membrane. Each pixel’s mean voltage above rest formed a feature for nonlinear feed-forward decoders. Their held-out accuracy across input rates informed the rates selected for variable-rate training of the three TR06 classifiers later evaluated on continuous streams.
These classifiers used the common isolated-image training protocol without an activity penalty, training input and readout weights while keeping recurrence fixed at standard strength (Fig. 10). For each image presentation, the maximum-pixel input rate, , was drawn with equal probability from the decoder-informed set: 0.5, 0.75, 1, 1.5, 2, 3, 5, 7.5, 10, 15 and 25 Hz. The rate remained constant throughout the presentation and was sampled independently for each image within a minibatch, then resampled on subsequent presentations.
TR06 classifiers used spiking leaky integrate-and-fire output units with the same decay, threshold and subtractive-reset dynamics described above. Their readout differed from ordinary classification: class logits were accumulated output-spike counts rather than mean pre-reset states:
Here, indicates an output spike; class index , logit and presentation length are defined above. Counts entered cross-entropy directly without decay or duration normalization, using the same surrogate derivative. Classification selected the largest final count, breaking ties by lowest class index.
Readout weights were initialized from a Gaussian distribution with dimensionless parent mean and parent standard deviation (Appendix A4), clamped below at zero without fan-in normalization, and then trained alongside the input weights. Both sets of weights were held fixed during evaluation. Evaluations used each network’s best-validation checkpoint. The same three validation-selected TR06 classifiers were evaluated across all duration–rate conditions. During continuous streams, output state and accumulated counts were reset to zero at each supplied image boundary, while hidden neuronal and synaptic states continued between images.
For quantitative streaming evaluation (Fig. 10E–F), we crossed presentation durations of 25, 50, 100 and 200 ms with the eleven maximum-pixel input rates used during training. Each of the three frozen TR06 classifiers processed 40 five-image streams per duration–rate combination, in batches of five streams. This gave 200 classification decisions per network and condition, and 26,400 decisions overall. Duration and input rate remained constant within each stream, and images followed without gaps. Each stream began with freshly initialized hidden and output states; subsequent image boundaries used the state-handling procedure described above.
For each stream, five images were sampled uniformly without replacement from the full 10,000-image official MNIST test partition, without class stratification. Digit labels could repeat within a stream, and images could recur across streams. We prespecified one bank of 40 ordered streams and reused the same image indices for every network, duration and rate. Thus, conditions shared both the target images and the preceding-image order. Spike encoding used separate generators with distinct seeds for all 5,280 network–condition–stream combinations (Appendix B5). The 26,400 decisions are repeated evaluations of this image bank, not that many independently sampled images.
Accuracy included all 200 decisions per network and condition, including presentations with no output spikes. Fig. 10E shows means across the three training replicates without uncertainty intervals; Fig. 10F reuses the 200-ms evaluations and shows means and SEM across those same replicates. Presentation and count-accumulation windows had equal duration, so their effects were not separated. We did not compare continuing hidden state with a hidden-state-reset control or test autonomous image segmentation.
For continuous-stream evaluation, all networks shared one image bank but used different encoding draws. Its SEM therefore summarizes variation across these trained networks and their encodings, conditional on the sampled images. One bank and one encoding draw per network, condition and stream do not separately estimate image-sampling, encoding and training variability. Image pairing does not make the 200 sequential decisions per condition independent network replicates.
We reused the TR06 illustrative recording (Fig. 10A–D), selected independently of quantitative evaluation using a predefined five-correct criterion, met by the first candidate (Appendix B4). It was not a stream from the shared quantitative image bank.
To visualize the evolving readout within each presentation (Fig. 10D), we transformed cumulative output-spike counts into softmax shares:
Here, counts class- output spikes through step since the supplied boundary; is its dimensionless share, with indexing classes. These uncalibrated shares visualize evidence; the 0.5 line is not a decision threshold.
Software and hardware
The study software was developed iteratively with AI coding agents (OpenAI Codex and Claude Code) under the lead author’s direction. The lead author specified the scientific models and experimental protocols, directed implementation and revisions, and retained responsibility for software acceptance and its scientific use. Verification included automated unit, integration and numerical-regression testing. Simulator tests cover neuronal and synaptic dynamics, spike and refractory timing, surrogate gradients, checkpoint restoration and training continuation. Numerical checks include analytical solutions, preserved reference outputs, and comparisons with independent Brian2 implementations of conductance-based dynamics and snnTorch implementations of current-based dynamics under matched conditions. Experiment-level tests cover checkpoint selection, spike perturbations, analysis outputs and data provenance. The implementations and test suites are publicly available for inspection and reuse.
The experiment code is maintained in the Pinglab experiments repository, and the spiking neural network (SNN) simulator is maintained in the SNNLab simulator repository. Spiking simulation, training and evaluation used custom Python/PyTorch code; all 90 classifiers were trained with PyTorch 2.11.0+cu128 on NVIDIA A100-SXM4 GPUs with 80 GB of device memory, using one CUDA device per classifier. Mean-field calculations used Python 3.10.19, NumPy 2.2.6 and SciPy 1.15.3. For TR01, mean training-loop and validation times over 50 epochs were 402 and 158 min for loop-off and 429 and 161 min for loop-on, respectively, averaged across three seeds per architecture. Mean epoch times, including training and validation, were 11.2 min for loop-off and 11.8 min for loop-on over epochs 2–50, excluding first-epoch warm-up, reference-image diagnostics and subsequent logging or checkpoint-file writes.
Appendix A — Discrete dynamics and gradient calculations
A1 — Discrete neuronal and synaptic updates. With denoting completed updates, conductances followed Equation 2: exponential decay preceded the full weighted spike increments. Recurrent input used the preceding update’s spikes; current external input entered before voltage integration. Newly emitted E/I spikes therefore reached the partner population on the following update. Standard parameters are in Table A1.
For each neuron, the updated conductances defined the total conductance and effective equilibrium voltage:
Holding these conductances constant over the step, we calculated the trial voltage
Here, is in µS, and and are voltages in mV. The numerical floor mV clipped extreme negative voltages before spike evaluation. Membrane capacitance , timestep , leak conductance , synaptic conductances , and reversal potentials retain their Methods definitions.
After calculating the trial voltage, we decremented the integer refractory counter by one, with a lower bound of zero. A neuron emitted a spike only when the decremented counter was zero and . Spiking or still-refractory neurons were assigned the reset voltage mV; otherwise, the trial voltage was retained. Each spike reloaded the counter with , where is the population-specific refractory duration and was an integer at every tested timestep. Spike eligibility therefore resumed on the -th subsequent update. Conductances continued evolving during refractory holds.
A2 — Output-state recurrence. Output units followed Equations 8–9 after the hidden update, using excitatory spikes emitted in the same timestep. Only one threshold was subtracted per update, so retained output state could remain above threshold. Mean-state and spike-count readouts accumulated
Here, is cumulative pre-reset state and cumulative output-spike count for class ; , and retain their Methods definitions. Neither accumulator decayed; final logits followed Equations 10 and 14. Output state and accumulators began at zero; supplied image-boundary resets cleared them before that step’s output drive.
A3 — Surrogate and damped derivatives. Spikes used the surrogate derivative in Equation 11. For voltage-gradient damping, the stop-gradient operator returned with zero backward derivative. We defined
where the damping divisor in both architectures. The operation preserved forward values and scaled backward derivatives by .
For both hidden populations, denotes the unclipped exponential-Euler voltage increment in Equation 17. Before clipping and reset,
Here, denotes voltage before clipping. Damping scaled every derivative through , including its dependence on conductances and previous voltage, while the additive path retained unit derivative. At fixed updated conductances, the resulting backward rule was
The subscript BP identifies the derivative used by backpropagation; timestep, total conductance and capacitance retain their Appendix A1 definitions. Conductance recurrences and the surrogate spike function received no separate damping factor.
Hidden reset and refractory decisions used Boolean masks and integer counters that were not differentiated. The retained-voltage branch carried zero derivative when a neuron spiked or remained refractory, while the spike-output branch retained surrogate gradients whenever the refractory mask permitted spiking. Voltage clipping also blocked gradients below the numerical floor.
Output updates received no voltage-gradient damping. Their subtractive reset retained the derivative through the output spike, giving
where denotes the surrogate derivative in Equation 11 and output-state symbols retain their Methods definitions in Equations 8–9. The current-step accumulator increment contributed a direct derivative for mean-state readout and a surrogate derivative for spike-count readout.
A4 — Initialization transformation. For each input or recurrent projection, we generated independent Gaussian draws and Bernoulli retention indicators, then formed the initial weights:
Here, and index presynaptic and postsynaptic neurons, respectively, and is presynaptic population size. Table A1 gives the Gaussian parent mean and parent standard deviation ; draws and weights are in µS. The zeroing probability was 0.95 for input and zero for recurrence; clamping negative draws added further zeros.
Writing for the mean after lower clamping, this transformation gave
Zeroing compensation therefore preserved expected summed incoming weight after clamping, not the parent mean or exact realised sum. Finite sampling and Bernoulli zeroing affected realised matrices. The mask applied only at initialization; initially zero trainable weights could become positive.
Readout weights followed a separate initialization:
Here, indexes output classes. These weights were dimensionless and used no additional Bernoulli zeroing or fan-in normalization. Their parent mean and standard deviation follow Table A1 for TR01–TR05 and the continuous-stream Methods for TR06.
Appendix B — Measurement algorithms and boundary cases
B1 — Spectral interpolation. We refined the spectral maximum using a parabola through three neighbouring bins of linear power spectral density. Let index the largest-power bin within the search interval, choosing the lowest-frequency bin when maxima were tied. The interpolated spectral-peak frequency was
Here, is the power spectral density at frequency bin , is the selected bin’s frequency, is the frequency-bin spacing in hertz, and is a dimensionless offset. Clipping limits the displacement to half a bin.
Neighbouring bins could lie outside the search interval, and the interpolated frequency was not subsequently restricted to that interval.
B2 — Rhythmicity metric implementation. We pooled excitatory spikes into complete 1-ms population-count bins, discarding any incomplete final bin. The dimensionless, uncentered autocorrelogram was
Here, is the excitatory population spike count in bin , is the number of complete bins, is their mean count, and is the lag in milliseconds.
We computed the numerator by inverse-transforming squared fast Fourier transform magnitudes, padding to the smallest power-of-two length of at least to prevent circular wraparound. The denominator corrected for overlapping bin pairs and firing-rate scale, giving approximately independent stationary counts a baseline near one.
We excluded zero lag’s self-matches, replaced that entry with its 1-ms neighbour, and smoothed with weights and zero padding at both ends.
Denoting the smoothed values by , we selected the first lag satisfying and . The lobe was the maximum at positive lags preceding this trough, with ties resolved by the earliest lag. These values entered the rhythmicity metric equation in Methods.
B3 — Burst detection and cycle-boundary discretization. For each presentation, we smoothed inhibitory population counts at 0.1-ms resolution with a unit-sum Gaussian kernel (SD 1 ms; ±4-ms extent, 81 samples), zero-padding beyond presentation boundaries. Candidate bursts were interior maxima reaching at least 5% of the presentation’s smoothed maximum; plateaus used their middle sample, rounded down. Minimum peak separation was half the network’s spectral period, rounded down to simulation steps and bounded below by one step. Smaller competing peaks were removed first; the same network-level spectral-peak frequency set separation for all presentations.
For consecutive detected peak indices and , we placed the intervening boundary at
where is an integer step index and the floor rounds downward. Outer boundaries were zero and the presentation length in steps. Per-neuron excitatory counts used intervals including their start and excluding their end, assigning boundary spikes to the following interval. Edge intervals could contain partial cycles. A single burst defined one whole-presentation interval; no bursts contributed no neuron–cycle pairs.
B4 — Illustrative-example selection. Fixed official-test examples, checkpoints and display conditions for Figs. 3A–B, 4 and 8A–B are specified in their captions. Figure 4 used the first official-test image; displayed neuron subsets were sampled uniformly without replacement using seed 0.
For Fig. 10A–D, each candidate contained five distinct digit classes in random order, with one official-test image sampled uniformly per class. We used the seed-42 TR06 classifier and the five predefined duration–rate pairs in the caption. Candidates were evaluated in a predetermined order until all five classifications were correct; the first candidate met this criterion. Image-selection and spike-encoding seeds were 820000 and 830000. This selection was independent of quantitative streaming evaluation.
B5 — Random-stream implementation. Post-training evaluation restarted a dedicated CPU encoding generator with seed 20260415, advancing through batches of 64 images without reseeding. Matching images, order, batching, timestep, duration and rates produced matched input spikes across networks. Deletion/insertion used a separate generator with seed 20260416; replay shifts used separate generators seeded by training replicate, jitter type and magnitude. Perturbations did not advance input-encoding draws.
For the quantitative streaming bank described in Methods, one NumPy image-sampling generator with seed 82000 advanced across the 40 streams. We recorded image indices and labels and checked each condition’s labels against the bank.
For spike encoding, we used an integer-pairing map to assign a distinct seed to each network, duration, rate and stream:
Here, maps two non-negative integers to one integer; indexes training seeds 42–44, indexes durations 25, 50, 100 and 200 ms, indexes the eleven input rates in ascending order, and indexes streams. Each of the 5,280 combinations initialized a CPU PyTorch generator with its unique seed , advancing across five presentations. Image sampling did not consume encoding draws; shared images therefore had separate spike encodings across networks and conditions.
Appendix C — Mean-field closure and numerical specification
C1 — Gain function and population-model assumptions. For each population , denoting excitatory and inhibitory neurons, we used the stationary noisy-LIF gain:
Here, is mean input current in nA; is leak conductance in µS; and is the corresponding effective mean voltage. The leak reversal, reset and threshold voltages are , and , respectively, in mV; mV is the prescribed voltage-noise scale. Membrane and refractory times, and , are in milliseconds, giving in . The integration variable is dimensionless, and is the error function. This expression gives the stationary firing rate of a LIF neuron driven by Gaussian white current noise (Eq. 21 in Brunel, 2000).[4]
The closure replaced synaptic current by , where is conductance, reversal potential and membrane voltage. Presynaptic rates replaced spike trains while conductances retained exponential decay; population rates relaxed towards with the assumed time constant . Methods states the consequences of fixed driving forces and the prescribed noise scale.
C2 — Numerical solution details. Table C1 specifies solvers, tolerances and sampling. At each of 401 equally spaced currents, we eliminated stationary conductances and inhibitory rate to obtain one scalar excitatory-rate residual, bracketed between zero and the refractory-limited maximum.
Among eligible complex eigenvalue pairs, we selected the largest real part. Its first negative-to-nonnegative crossing bracketed onset; refinement recomputed equilibrium and Jacobian at each trial current. Transversality used a centred real-part difference around onset.
The upward sweep used 25 equally spaced currents from to nA, where is onset current. We increased the lowest-current equilibrium’s excitatory rate by and carried each integration’s final state into the next, including the descending sweep. Amplitudes used fixed sampling times rather than adaptive solver-output times.
For gain integration, negative dimensionless arguments used the scaled complementary error function to avoid cancellation; nonnegative arguments capped at 700.
| Numerical operation | Method and setting |
|---|---|
| Gain quadrature | Adaptive QUADPACK integration; absolute and relative tolerances both ; maximum 200 subintervals |
| Equilibrium root finding | Scalar Brent method; absolute rate tolerance , relative tolerance and accepted residual at most |
| Continuous-time Jacobian | Analytical four-variable flow Jacobian |
| Complex-eigenvalue eligibility | Positive imaginary part greater than |
| Onset refinement | Brent’s method; absolute current tolerance nA and relative tolerance ; transversality step nA |
| Upward/downward integration | LSODA; relative tolerance ; scalar absolute tolerance ; maximum step 1 ms; no supplied Jacobian |
| Amplitude sampling | Peak-to-peak excitatory rate over 1,001 fixed samples spanning the final 500 ms of each 2,000-ms integration |
Numerical settings for mean-field continuation, onset refinement and amplitude sweeps. Calculations used SciPy 1.15.3. Quadrature tolerances used library defaults. The absolute integration tolerance applied to rates in and conductances in µS; relative tolerances were dimensionless. Unlisted solver options retained their defaults.
C3 — Criticality calculation. We defined the hysteresis gap as the maximum absolute difference between upward and downward peak-to-peak excitatory-rate amplitudes at matched currents. For the amplitude-squared regression, we included all upward-sweep points satisfying nA, where is the refined onset current. Membership depended only on current, without an amplitude cutoff.
For each included point , we defined excess current and squared amplitude , where the upward arrow identifies the ascending sweep. We fitted by unweighted least squares, with slope and freely fitted intercept . The coefficient of determination was
where is mean squared amplitude over the included points.
We classified the sampled onset as consistent with a supercritical transition only when the hysteresis gap was below , , and . All other outcomes were labelled “subcritical/inconclusive”. The finite-sweep interpretation limits are stated in Methods.
Appendix D — Exact replay transformations
D1 — Quantization and boundary reflection. For Fig. 8, we converted Gaussian timing offsets to integer simulation-step displacements:
Here, is the integer displacement, is a standard-normal draw, and and are the proposed jitter standard deviation and simulation timestep, respectively, in milliseconds. Rounding used nearest integers with ties to even. Independent jitter drew per event; group jitter drew per presentation and original source window.
For an integer , reflection into inclusive integer bounds was
where is interval span and modulo returns a nonnegative remainder. Reflection handled arbitrarily many boundary crossings.
For independent jitter, an event at original index received candidate index , where is the presentation’s number of simulation steps. For group jitter, let and be the earliest and latest original inhibitory-event indices within a source window, across all inhibitory neurons. We reflected the shared displacement into , then added it to every event in that group. Group membership remained defined by the original timeline. Zero jitter returned the original stream unchanged.
D2 — Collision resolution. After reflection, we resolved duplicate destinations separately for each presentation and inhibitory neuron. The earliest original event at each shared destination retained it; others tried offsets , measured from their respective reflected candidate indices. We skipped out-of-range proposals and rechecked all destinations after each pass, resolving new collisions with the same chronological priority.
Once destinations were in range and unique, we reconstructed binary streams preserving each neuron’s count within every presentation. Individual collision adjustments could change relative timing within shifted groups.
Network diagrams
Parameters
Model values are read from original native snapshots through the selected presentation’s compute ancestry. Paired values are E / I. Initializer parent means and SDs describe the original weight distributions, in µS for conductance projections and dimensionless for the current-based readout; they are not measured trained-weight statistics. Missing snapshots or fields are unavailable; current recipes and historical copied tables are not substituted. The recorded configuration identifies the input, numerical and analysis choices of that computation; it does not establish a separate upstream training protocol.
| Parameter | COBA | PING |
|---|---|---|
| Network | ||
| E / I neurons | Unavailable / Unavailable | Unavailable / Unavailable |
| Output neurons | Unavailable | Unavailable |
| Neurons | ||
| Capacitance, E / I (nF) | Unavailable / Unavailable | Unavailable / Unavailable |
| Leak conductance, E / I (µS) | Unavailable / Unavailable | Unavailable / Unavailable |
| Resting voltage, E / I (mV) | Unavailable / Unavailable | Unavailable / Unavailable |
| Threshold, E / I (mV) | Unavailable / Unavailable | Unavailable / Unavailable |
| Reset, E / I (mV) | Unavailable / Unavailable | Unavailable / Unavailable |
| Refractory period, E / I | Unavailable / Unavailable | Unavailable / Unavailable |
| Synapses and weights | ||
| Input→E synapse | Unavailable / Unavailable | Unavailable / Unavailable |
| E→I synapse | Unavailable / Unavailable | Unavailable / Unavailable |
| I→E synapse | Unavailable / Unavailable | Unavailable / Unavailable |
| E→Output synapse | Unavailable / Unavailable | Unavailable / Unavailable |
| Input→E initializer parent mean / SD | Unavailable / Unavailable | Unavailable / Unavailable |
| E→I initializer parent mean / SD | Unavailable / Unavailable | Unavailable / Unavailable |
| I→E initializer parent mean / SD | Unavailable / Unavailable | Unavailable / Unavailable |
| E→Output initializer parent mean / SD | Unavailable / Unavailable | Unavailable / Unavailable |
| Native parameter stage | Unavailable | Unavailable |
| Input and simulation | ||
| Timestep (ms) | Unavailable | Unavailable |
| Duration (ms) | Unavailable | Unavailable |
| Evaluation samples | 1000 | 1000 |
| Seeds | Unavailable | Unavailable |
| Input rate (Hz) | Unavailable | Unavailable |
| Post-burn exclusion (ms) | Unavailable | Unavailable |
| Readout and training | ||
| Output neuron model | Unavailable | Unavailable |
| Epochs | Unavailable | Unavailable |
| Checkpoint role | final_epoch | final_epoch |
| Checkpoint purpose | endpoint_dynamics | endpoint_dynamics |
| Analysis | ||
| Frequency search (Hz) | Unavailable | Unavailable |
| Count-bin width (ms) | Unavailable | Unavailable |
| Autocorrelation maximum lag (ms) | Unavailable | Unavailable |
Dataset
Upstream: exp022 — MNIST, exp023 — Turning the PING Loop On, exp025 — Inhibition, Accuracy and Firing, exp037 — Dropped Spikes vs Added Noise, exp038 — Switching On the Inhibitory Loop, exp041 — Firing Rate Tracks Gamma Frequency, exp042 — Inhibitory Replay and E Firing, exp044 — Firing Rate Across the Timestep Sweep, exp046 — One Spike per Gamma Cycle, exp049 — Recurrent Learning Weakens Rhythmicity, exp054 — Pinglab Rythmicity Metric, exp082 — Spike-Count Stream Classification, exp117 — Mean-Field Analysis of PING Bifurcations
Downstream: —
Current runset
| Run | Date | Duration | Size | Evidence | Storage | Ran on | Verification |
|---|---|---|---|---|---|---|---|
| exp110-r031-present | 1s | 656.7 KB | Current | R2 | Local | Local: absent; R2: catalog-verified | |
| exp117-r024-analyse | <1s | 265 KB | Current | R2 | Local | Local: absent; R2: catalog-verified | |
| exp117-r023-compute | 30s | 1.6 MB | Current | R2 | Local | Local: absent; R2: catalog-verified | |
| exp054-r016-analyse | 4s | 711.2 KB | Current | R2 | Local | Local: absent; R2: catalog-verified | |
| exp054-r015-compute | 7m 37s | 11.3 MB | Current | R2 | Local | Local: absent; R2: catalog-verified | |
| exp046-r010-present | 2s | 718.6 KB | Current | R2 | Local | Local: absent; R2: catalog-verified | |
| exp037-r020-present | 20s | 1.6 MB | Current | R2 | HPC | Local: absent; R2: catalog-verified | |
| exp037-r019-analyse | 15s | 392.9 KB | Current | R2 | HPC | Local: absent; R2: catalog-verified | |
| exp037-r018-compute | 46m 34s | 1.5 MB | Current | R2 | HPC | Local: absent; R2: catalog-verified | |
| exp022-r015-compute | 12h 58m 52s | 3.6 GB | Current | R2 | HPC | Local: absent; R2: catalog-verified | |
| exp046-r007-analyse | 25s | 465.9 KB | Current | R2 | Local | Local: absent; R2: catalog-verified | |
| exp044-r009-present | 2s | 376.4 KB | Current | R2 | Local | Local: absent; R2: catalog-verified | |
| exp044-r008-analyse | 3s | 152.8 KB | Current | R2 | Local | Local: absent; R2: catalog-verified | |
| exp044-r007-compute | 2m 25s | 112.7 KB | Current | R2 | Local | Local: absent; R2: catalog-verified | |
| exp022-r007-compute | 11h 16m 8s | 3.6 GB | Current | R2 | HPC | Local: absent; R2: catalog-verified | |
| exp041-r005-present | 2s | 572.7 KB | Current | R2 | Local | Local: absent; R2: catalog-verified | |
| exp046-r001-compute | — | 101.5 MB | Current | R2 | Unknown | Local: absent; R2: catalog-verified | |
| exp041-r002-analyse | 3s | 1.8 MB | Current | R2 | Local | Local: absent; R2: catalog-verified | |
| exp041-r001-compute | — | 7.7 MB | Current | R2 | Unknown | Local: absent; R2: catalog-verified | |
| exp022-r001-compute | 2d 7h 4m 16s | 2 GB | Current | R2 | HPC | Local: absent; R2: catalog-verified |
Other stored runs (21)
These runs are outside this experiment's current runset. Their evidence status explains why they remain stored.
| Run | Date | Duration | Size | Evidence | Storage | Ran on | Verification |
|---|---|---|---|---|---|---|---|
| exp049-r020-present | 5s | 3.8 MB | Required by current:exp049, deployment:40549382638/1, report:exp049, report:exp110 | R2 | Local | Local: absent; R2: catalog-verified | |
| exp049-r018-analyse | 3s | 482.6 KB | Required by current:exp049, deployment:40549382638/1, report:exp049, report:exp110 | R2 | Local | Local: absent; R2: catalog-verified | |
| exp049-r017-compute | 12s | 19.4 MB | Required by current:exp049, deployment:40549382638/1, report:exp049, report:exp110 | R2 | Local | Local: absent; R2: catalog-verified | |
| exp025-r014-present | 5s | 1.4 MB | Required by current:exp025, deployment:40549382638/1, report:exp025, report:exp110 | R2 | Local | Local: absent; R2: catalog-verified | |
| exp025-r013-analyse | 4s | 214.7 KB | Required by current:exp025, deployment:40549382638/1, report:exp025, report:exp110 | R2 | Local | Local: absent; R2: catalog-verified | |
| exp042-r020-present | 1s | 195.2 KB | Required by current:exp042, deployment:40549382638/1, report:exp042, report:exp110 | R2 | Local | Local: absent; R2: catalog-verified | |
| exp023-r026-present | 1s | 1.3 MB | Required by current:exp023, deployment:40549382638/1, report:exp023, report:exp110 | R2 | Local | Local: absent; R2: catalog-verified | |
| exp023-r024-analyse | <1s | 253.3 KB | Required by current:exp023, deployment:40549382638/1, report:exp023, report:exp110 | R2 | Local | Local: absent; R2: catalog-verified | |
| exp023-r023-compute | 14s | 2.5 MB | Required by current:exp023, deployment:40549382638/1, report:exp023, report:exp110 | R2 | Local | Local: absent; R2: catalog-verified | |
| exp082-r033-present | 3s | 1.5 MB | Required by current:exp082, deployment:40549382638/1, report:exp082, report:exp110 | R2 | Local | Local: absent; R2: catalog-verified | |
| exp082-r032-analyse | 2s | 174.2 KB | Required by current:exp082, deployment:40549382638/1, report:exp082, report:exp110 | R2 | Local | Local: absent; R2: catalog-verified | |
| exp082-r031-compute | — | 686.6 KB | Required by current:exp082, deployment:40549382638/1, report:exp082, report:exp110 | R2 | Unknown | Local: absent; R2: catalog-verified | |
| exp038-r011-present | 21s | 683.2 KB | Required by current:exp038, deployment:40549382638/1, report:exp038, report:exp110 | R2 | HPC | Local: absent; R2: catalog-verified | |
| exp038-r010-analyse | 21s | 126.2 KB | Required by current:exp038, deployment:40549382638/1, report:exp038, report:exp110 | R2 | HPC | Local: absent; R2: catalog-verified | |
| exp038-r009-compute | 40m 35s | 996.5 KB | Required by current:exp038, deployment:40549382638/1, report:exp038, report:exp110 | R2 | HPC | Local: absent; R2: catalog-verified | |
| exp025-r009-analyse | 1m 4s | 205.4 KB | Required by current:exp025, deployment:40549382638/1, report:exp025, report:exp110 | R2 | HPC | Local: absent; R2: catalog-verified | |
| exp025-r008-compute | 1h 11m 46s | 33 MB | Required by current:exp025, deployment:40549382638/1, report:exp025, report:exp110 | R2 | HPC | Local: absent; R2: catalog-verified | |
| exp042-r019-present | 1s | 192.1 KB | Required by current:exp042, deployment:40549382638/1, report:exp042, report:exp110 | R2 | Local | Local: absent; R2: catalog-verified | |
| exp042-r008-analyse | 4s | 67.5 KB | Required by current:exp042, deployment:40549382638/1, report:exp042, report:exp110 | R2 | HPC | Local: absent; R2: catalog-verified | |
| exp042-r007-compute | 48s | 216.6 KB | Required by current:exp042, deployment:40549382638/1, report:exp042, report:exp110 | R2 | HPC | Local: absent; R2: catalog-verified | |
| exp049-r001-compute | — | 43.6 MB | Required by current:exp049, deployment:40549382638/1, report:exp049, report:exp110 | R2 | Unknown | Local: absent; R2: catalog-verified |
References
-
G. Buzsáki and X.-J. Wang. “Mechanisms of Gamma Oscillations.” Annual Review of Neuroscience 35, 203–225 (2012). doi:10.1146/annurev-neuro-062111-150444
-
W. Gerstner, W. M. Kistler, R. Naud, and L. Paninski. Neuronal Dynamics: From Single Neurons to Networks and Models of Cognition. Cambridge University Press (2014), §1.3, “Integrate-And-Fire Models.”
-
E. O. Neftci, H. Mostafa, and F. Zenke. “Surrogate Gradient Learning in Spiking Neural Networks: Bringing the Power of Gradient-Based Optimization to Spiking Neural Networks.” IEEE Signal Processing Magazine 36(6), 51–63 (2019). doi:10.1109/MSP.2019.2931595
-
N. Brunel. “Dynamics of Sparsely Connected Networks of Excitatory and Inhibitory Spiking Neurons.” Journal of Computational Neuroscience 8(3), 183–208 (2000). doi:10.1023/A:1008925309027